Total Quality Management Tools- A Comprehensive Guide
Quality management tools ensure that projects meet client expectations, stay on track, and are completed within scope, time, and budget constraints. The integration of these tools throughout the project process empowers teams to proactively tackle issues and minimize errors. This ensures that deliverables consistently meet both technical specifications and customer expectations. Basically quality management tools enable project managers to create structured frameworks for delivering high-quality results consistently.

What Are Quality Management Tools?
Total Quality management tools are techniques used to ensure that a product or service meets the desired standards and satisfies customer expectations. These tools help identify, monitor, and manage quality throughout the project lifecycle. They are designed to improve processes, reduce defects, and achieve consistency.
18 Quality Management Tools and Techniques
Quality management tools and techniques are essential for monitoring, controlling, and improving processes throughout a project. Here are some of the most commonly used quality management tools and techniques:
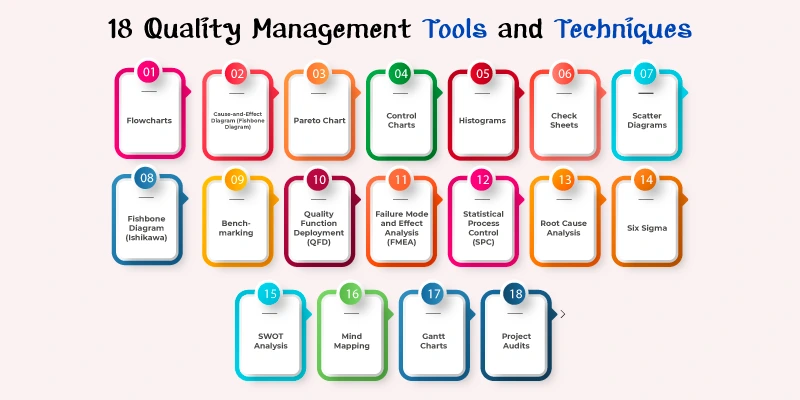
1. Flowcharts
Flowcharts visually map out processes to help teams understand and identify inefficiencies. They use standardized symbols to represent steps in a process, making it easy to detect bottlenecks and areas for improvement. Flowcharts are particularly useful for analyzing workflows and ensuring processes are standardized.
2. Cause-and-Effect Diagram (Fishbone Diagram)
Also known as the Ishikawa diagram, this tool helps identify the root causes of a problem. The diagram resembles a fishbone, with the "bones" representing various categories of potential causes (such as people, processes, machines, etc.). It's a powerful tool for brainstorming and analyzing complex issues in processes.
3. Pareto Chart
A Pareto chart is a bar chart that displays the frequency or impact of problems in descending order. Based on the 80/20 rule (also known as the Pareto Principle), it helps teams identify the most significant issues that need attention. This chart helps prioritize efforts by focusing on the few issues that will make the biggest difference.
4. Control Charts
Control charts track process performance over time and indicate how a process is performing against defined limits. By plotting data points and observing trends, control charts help identify when a process is out of control and requires corrective action. They are particularly useful for monitoring ongoing processes and ensuring consistency.
5. Histograms
Histograms are graphical representations of data distribution. They show the frequency of data points within certain ranges, helping teams analyze patterns or trends. Histograms are especially helpful in visualizing variations and understanding the spread of data.
6. Check Sheets
Check sheets are simple tools used to collect data systematically. They often take the form of a table or list where data can be marked off as it’s observed. Check sheets are commonly used for tracking the occurrence of specific issues or defects, providing easy-to-understand data for analysis.
7. Scatter Diagrams
Scatter diagrams show the relationship between two variables by plotting data points on a graph. This helps teams understand the correlation between factors (for example, how temperature affects product quality). It’s a valuable tool for identifying trends and making data-driven decisions.
8. Fishbone Diagram (Ishikawa)
The Fishbone diagram, also known as the Ishikawa diagram, helps identify potential causes of a specific problem. It categorizes causes into six main groups: people, processes, equipment, materials, environment, and management. This visualization helps uncover issues that may not be immediately obvious.
9. Benchmarking
Benchmarking involves comparing an organization’s processes, performance, and products against industry standards or best practices. By identifying areas where improvements are needed, benchmarking helps businesses learn from top performers and apply similar strategies to achieve competitive advantage.
10. Quality Function Deployment (QFD)
QFD is a technique used to translate customer needs and requirements into specific product or service features. Often referred to as the “House of Quality,” this method helps ensure that customer demands are directly addressed throughout the design and production process. QFD links customer feedback with engineering and production specifications.
11. Failure Mode and Effect Analysis (FMEA)
FMEA is a systematic method for evaluating potential failures in a product or process and their consequences. The tool helps identify which failures are most likely and most damaging. By prioritizing risks based on their severity and probability, FMEA enables teams to focus on mitigating the most critical issues.
12. Statistical Process Control (SPC)
SPC uses statistical methods to monitor and control processes. It involves collecting data from a process and analyzing it to ensure that it remains stable and operates within predefined limits. SPC is essential for detecting variations, preventing defects, and maintaining process consistency.
13. Root Cause Analysis
Root cause analysis (RCA) is used to investigate and identify the underlying causes of problems. Rather than just addressing symptoms, RCA digs deeper to uncover the true cause of an issue. By solving the root cause, teams can prevent recurring problems and implement long-term solutions.
14. Six Sigma
Six Sigma is a data-driven methodology aimed at improving process quality by identifying and removing causes of defects. Using a set of tools and techniques, Six Sigma focuses on reducing variation and improving process efficiency. It strives for perfection, aiming for no more than 3.4 defects per million opportunities.
15. SWOT Analysis
SWOT analysis is a strategic planning tool used to assess the strengths, weaknesses, opportunities, and threats facing an organization or project. It’s a simple yet effective way to evaluate internal and external factors that can impact quality and performance. This analysis helps teams develop strategies for improvement and competitive advantage.
16. Mind Mapping
Mind mapping is a visual brainstorming technique that helps organize ideas and concepts. It starts with a central idea or problem and branches out into related subtopics. It’s an excellent tool for exploring ideas, solving problems, and mapping out complex projects or issues related to quality.
17. Gantt Charts
Gantt charts are visual tools used to plan and schedule tasks over time. They display tasks as horizontal bars along a timeline, helping teams track progress and deadlines. Gantt charts are particularly useful for managing projects with multiple activities, ensuring that resources are allocated efficiently to maintain quality throughout the project.
18. Project Audits
Project audits are systematic reviews conducted to evaluate project performance, quality processes, and compliance with standards. Audits help identify gaps, inefficiencies, and areas for improvement. They provide valuable insights into how a project is being executed and where adjustments are needed to meet quality objectives.`
Read More: Total Quality Management: Best Practices and Strategies
Benefits of Using Quality Management Tools
Quality management tools offer several advantages. They help project teams:
- Identify Issues Early: These tools allow teams to spot problems before they escalate, saving time and resources.
- Improve Processes: They provide insights into inefficiencies and bottlenecks, helping teams optimize workflows.
- Maintain Consistency: Regular use of quality management tools ensures that processes remain consistent and standards are met.
- Enhance Customer Satisfaction: By adhering to quality standards, teams can deliver products that meet or exceed customer expectations.
- Ensure Compliance: Quality management tools help maintain regulatory and industry standards.
AMREP Mexico's Commitment to Quality
At AMREP Mexico, we understand the importance of maintaining high standards throughout every phase of the project. By continually embracing QMT tools, we can drive efficiency, minimize errors, and deliver exceptional results that align with both technical requirements and customer needs. Our commitment to quality not only enhances project outcomes but also strengthens our partnerships with clients.
A key component of this process is our supplier management services, which are essential to Total Quality Management (TQM). By ensuring that our suppliers consistently meet quality standards, we improve the overall success and efficiency of each project. This collaboration guarantees that every element of the project, from procurement to final delivery, is held to the highest quality standards, contributing to the seamless execution of our projects.
Frequently Asked Questions
Why are quality management tools important?
Quality management tools are important because they help identify issues early, improve processes, and ensure that products meet the desired standards.
How do quality management tools improve project management?
They improve project management by offering methods for monitoring quality, identifying bottlenecks, and maintaining consistency throughout the project.
What are the most common quality management tools?
Common tools include flowcharts, cause-and-effect diagrams, Pareto charts, control charts, and histograms.
Can quality management tools be used in all industries?
Yes, quality management tools are versatile and can be used in various industries, including manufacturing, healthcare, IT, and service sectors.
How do I choose the right quality management tool?
The choice of tool depends on the specific needs of the project. Assess the problem, required data, and desired outcomes before selecting a tool.
Are Quality Management Tools only for large projects?
No, quality management tools are beneficial for projects of all sizes. They help streamline processes, improve quality, and ensure project success, regardless of the project's scope.
How do Quality Management Tools support team collaboration?
These tools provide a structured framework and a common language for the project team, enhancing communication, aligning goals, and fostering a collaborative environment that drives quality results.
What are the benefits of using Quality Management Tools in a project?
Benefits include improved product quality, enhanced customer satisfaction, better risk management, increased efficiency, reduced costs, and continuous process improvement throughout the project.